Ronald Wharton, MD: Greetings from the Bronx. This is Dr Ronald Wharton. I am a cardiologist at Montefiore Medical Center at the Albert Einstein College of Medicine, and I am sharing a case which I thought you would enjoy. I call it, "Why Is There Dyspnea? Start With the Doppler."
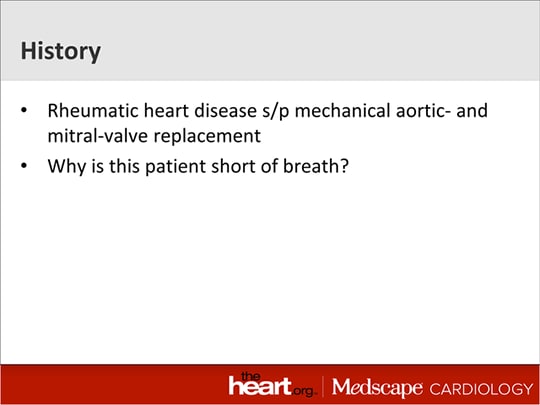
This is a patient who was admitted because of shortness of breath, and they have a history of rheumatic heart disease. As you will see in the echocardiograms, they have mechanical mitral and aortic prostheses.

The next image is an M-mode through the aortic valve. You may look at this M-mode and say, this doesn't really tell me much of anything. The only thing the M-mode shows you is the rise and fall of the aorta through the cardiac cycle. Keep an eye on that and we'll come back to that.

In the next slide, we see a parasternal long axis. You can see the mechanical and a prosthesis of the mitral and the aortic positions. The left ventricular (LV) systolic function I would consider on par with a lower limit of normal.

Now you see an apical four-chamber view. You will notice the right ventricle (RV) and right atrium (RA) are normal in size. There is a pacemaker wire in the right side of the heart. You can see the mechanical mitral prosthesis opening and closing nicely. Again, the LV systolic function I would consider at the lower limit of normal with the ejection fraction (EF) at 55%, just eyeballing it.

You see a pulse Doppler through the mechanical mitral prosthesis. You can see the E velocity is about 1.8 m/s; the late diastolic velocity (A velocity) about 1.1 m/s. There's a fairly steep deceleration time of the E-wave.

In the next slide, you can see the same area being interrogated with continuous-wave Doppler. We have somewhat similar findings.

I am showing you a continuous-wave Doppler in the short axis around the aortic-valve level. This is a TR signal with a peak velocity of slightly more than 4 m/s, so you can see that there's considerable pulmonary hypertension here—4x42 is 64 mm virtually, and even if the right atrial pressure is only roughly 5, you've got a [pulmonary-artery] PA systolic pressure of close to 70 mm Hg, consistent with severe pulmonary hypertension.

In the next slide, there is a continuous-wave Doppler through the aortic valve. Look at this carefully. You can see the peak velocity here through the aortic-valve prosthesis is about 2 m/s. There is no aortic regurgitation signal, and there are a lot of valve clicks, which I want you to look at closely for a second, because we'll come back to those. You can see the opening and closing of the mechanical aortic and the mechanical mitral valve because of the location of the continuous-wave Doppler going through both the aortic prosthesis and the "anterior" prosthesis of the mitral valve.

Let's summarize everything we've seen. We had the M-modes to the aortic valve, and you notice that in the M-mode of the aortic valve, the aorta was going up and down a lot. That's usually very good because that means that the end diastolic and end systolic volumes of the left atrium are considerably different, or put in another way, there's a considerable stroke vying through the left atrium, since the left atrial size changes so much between its own and diastole and systole, the aorta is bouncing up and down.
This is frequently a sign of good health on your average everyday echocardiogram. The mitral inflow velocity was slightly more than 2 m/s. That's a little on the high side, but the deceleration time of the E-wave was steep—it was a short deceleration time. Probably in the vicinity of about 116 ms or so; it certainly was not prolonged. The continuous-wave Doppler for the mitral valve did not demonstrate any mitral gurgitation signal.

The peak velocity of the mitral E-wave was within normal limits. The tricuspid regurgitation (TR) jet, however, demonstrates significant pulmonary hypertension. Can we explain this based on the information that we already have?

Well, let's take another look at a continuous-wave Doppler that I already showed you through the aortic valve.
Now again, you don't see any aortic insufficiency here. The velocity through the aortic valve prosthesis of about 2 m/s is normal. But look at the valve clicks, and again, the valve clicks come when the mitral and aortic valves open and when they close. If you look at any QRS complex, immediately after the QRS complex, the first click means that the mitral valve has closed. Then you have the isovolumic contraction period, and then the aortic valve click demonstrating the aortic valve opening, followed by the ejection period, during which you have the continuous-wave Doppler signal through the left ventricular outflow tract (LVOT) and the aorta.

Now let's look at the next two clicks. Those are the isovolumic clicks that correspond to isovolumic relaxation, where you have first the closure of the aortic valve followed by the opening of the mitral valve. Look at the distance between the two clicks at isovolumic contraction, and look at the distance between the two clicks during isovolumic relaxation.
Do you notice that the two clicks during isovolumic relaxation are virtually superimposable? You really can't distinguish them. They're so packed right on top of each other. That means that the isovolumic relaxation period has to be short, and if you have a short isovolumic relaxation time (IVRT), you have to have, in this case, a high left atrial pressure. It's not because the LV is a superb diastolic machine—this is a patient with a large left atrium and a mechanical prosthesis—so the left atrial pressure has to be a little higher than would be otherwise because when you put a mechanical valve in or any other valve, you have some inherent mitral stenosis. But here, the IVRT is so short that the [left atrial] LA pressure must be very high.

Let's compare the flows in the LVOT and the mitral valve. Here is a pulse-wave Doppler through the LVOT. The time velocity integral calculates to 11.1 cm; that's just the integral of the tracing that you see there.

Here is a continuous-wave Doppler through the mitral valve again—this is just at a higher sweep speed—and the time velocity integral (TVI) through the mitral valve during diastole is 53.1 cm. Now there happen to be some data on these things.

The TVIs of the mitral inflow and the LVOT are 53.1 cm and 11.1 cm, respectively. The ratio of those two is 4.78 cm. The mitral E-velocity in our continuous-wave Doppler was about 2.1; on the pulse wave was about 1.9. The deceleration time in this E-velocity was short. Again, it was steep because it can be that the isovolumic relaxation period is short, and therefore, the E-wave deceleration time has to be short as well, because those two parameters, the IVRT and the deceleration time, always parallel each other. We also know that the LA volume is going up and down a lot because the aorta is bouncing up and down on the M-mode.

So what's normal? This is actually studied—the parameters by which you can infer normal valve function in a situation where you have a mitral prosthesis as follows: the TVI ratio of the mitral valve to the LVOT should be less than 2.2. The E-velocity should be less than 1.9, and the pressure half-time of the E-wave, under normal conditions, should be less than 130 ms.
In this case, we have a very high TVI ratio. The pressure half-time is relatively short—I didn't actually measure it here, but it looks pretty short—and the E-velocity is on the high side, it's about 2.2. So the data in this case suggest there's significant mitral regurgitation (MR) even though we saw no MR at all in the continuous-wave Doppler. I provided you the reference to these parameters. This is from an article that was published in the Journal of American Society of Echocardiography 12 years ago.[1]
I'm telling you from all of these images that there's a lot of MR. Why did we not see it on the Doppler signal? Very simple. It's paravalvular, but you have to look for it. In the parasternal long axis, which

I'm showing you in the next image, you really don't see it at all. You see a turbulent jet going through the mitral valve during diastole, headed toward the interventricular septum, as is standard of all prosthetic valves, which direct blood toward the septum instead of the apex.

In the next slide, you can see in the apical four-chamber view, the MR jet, which is paravalvular, and coming very close to where the aorta valve is.

This is a zoom image with the 2-D image next to it, just to compare so you can see exactly where this is. When you see an MR jet that looks like that, combined with a TR jet of 4 m/s, you can assume that those two are very much related and that the pulmonary hypertension is due to significant, likely severe, paravalvular mitral regurgitation. You could make that inference all from just looking at a couple of Doppler signals and an M-mode.
This is Dr Ronald Warton from Bronx, New York, for theheart.org|Medscape Cardiology. I hope you enjoyed this. Thank you for listening.
© 2017 WebMD, LLC
Any views expressed above are the author's own and do not necessarily reflect the views of WebMD or Medscape.
Cite this: Echo Case: Why Is There Dyspnea? Start With the Doppler - Medscape - Aug 25, 2017.


Comments