Find the latest COVID-19 news and guidance in Medscape's Coronavirus Resource Center.
This transcript has been edited for clarity.
Welcome to Impact Factor, your weekly dose of commentary on a new medical study. I'm Dr F. Perry Wilson of the Yale School of Medicine.
Possibly the most maddening statistic to find during this pandemic has been one of the simplest: the number of COVID infections.
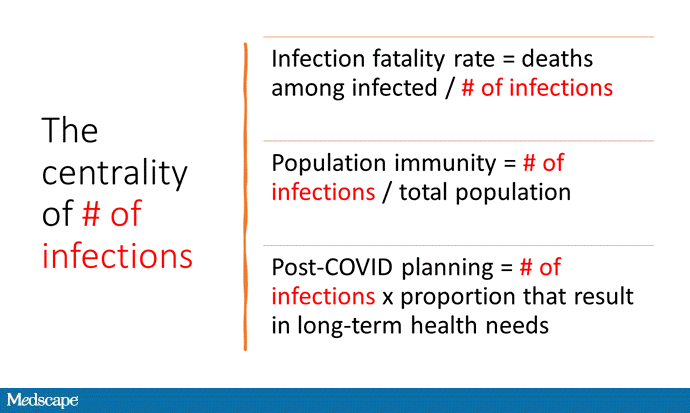
This number, whatever it is, is critical for so many reasons. It forms the denominator for the infection fatality rate — how serious this virus is compared with all the others out there. It also tells us what proportion of the population might already have substantial immunity, which might change vaccination thresholds targeting herd immunity. It would also help us plan for the future, insofar as some individuals who were infected will likely have substantial health needs long after the pandemic subsides.
But the total number of COVID infections has been tricky to pin down, thanks largely to its stubborn ability to infect people and cause minimal — or even no — symptoms. Combine that with a lack of easy access to testing early on, and an ongoing reticence toward testing since we force quarantine on people who test positive without guaranteeing their wages, and you have a recipe for an undercount.
There have been multiple attempts to estimate the true cumulative incidence of SARS-CoV-2 infections in the US, most notably by the CDC, which as of April 2021 suggested that there have been 114 million infections in the US (of which about a quarter were detected through testing).
But there are limitations to the CDC approach, including some pretty rough assumptions about the likelihood of infected people seeking care.
A new approach, reported in the Proceedings of the National Academy of Sciences by Adrian Raftery and Nicholas Irons, leverages several data sources — reported case rates, death rates, and testing rates, all varying over time and place — to get a better estimate of the number of infections.
Before we get too deep into this, I think it's helpful to imagine the easy way to figure out how many people have been infected. The easy way (the way many of us think we should have been doing it all along) is systematic random sampling of the population for antibodies to coronavirus. We do this for other things all the time; it's how we know what the average cholesterol level of an American is, for example.
But so far, only two states, Indiana and Ohio, have done a systematic job of randomly sampling their populace to figure out how many people have been infected. Raftery and Irons anchor their statistical model to these states and then use those high-quality data to extrapolate to the rest of the US.
The results suggest that from March 2020 to March 2021, 65 million people — roughly 20% of the US population — had been infected with the coronavirus. I want to note that this is substantially lower than the CDC estimates of infections in that time period.
That has multiple important implications. The CDC estimates suggest that the infection fatality rate of the virus is 0.5%. Keep in mind that this is different from the case fatality rate, which is the death rate among people who actually test positive. The 0.5% figure dilutes the denominator by including those who never knew they were infected.
But the Raftery data suggest that the infection fatality rate is a fair amount higher, around 0.8% or 0.9%. They break it down by state, with a low of around 0.2% in Utah and a high of 1.7% in Massachusetts.

Credit: Rebecca Gourley/University of Washington
So, how do we know that this model is any more accurate than the others? Fortunately, the authors published their projections of coronavirus infections and deaths based on their data, which were truncated in March 2021.

Irons NJ, et al. PNAS. 2021;118:e2103272118. https://doi.org/10.1073/pnas.2103272118
Comparing their projections to reality looks pretty good, though they don't capture the new spike in infections from the Delta variant. This may be due to some of the assumptions of their model, which includes the idea that individuals who were previously infected cannot become infected again.
They also incorporated vaccination data into their model of overall infection to plot what percentage of Americans would be immune to the virus.

Irons NJ, et al. PNAS. 2021;118:e2103272118. https://doi.org/10.1073/pnas.2103272118
They project that by August, roughly 70% of the population will have immunity, largely through the vaccination effort. Herd immunity for the Delta variant is probably around 75% or 80%, so this looks pretty good. But here, too, the model assumptions — which include the idea that 2 million individuals will be vaccinated every day — might be overly optimistic. We're actually giving just over 500,000 shots a day right now.
Altogether, this model has a bit of a sad story to tell. The virus is slightly deadlier than we may have thought, and herd immunity slightly farther away. If accurate, it suggests that we may be in for a difficult fall.
F. Perry Wilson, MD, MSCE, is an associate professor of medicine and director of Yale's Clinical and Translational Research Accelerator. His science communication work can be found in the Huffington Post, on NPR, and here on Medscape. He tweets @fperrywilson and hosts a repository of his communication work at www.methodsman.com.
Follow Medscape on Facebook, Twitter, Instagram, and YouTube
Medscape © 2021 WebMD, LLC
Any views expressed above are the author's own and do not necessarily reflect the views of WebMD or Medscape.
Cite this: How Many COVID Cases Do We Really Have? - Medscape - Jul 28, 2021.


Comments